
July 28, 2012 by desertrose
Earthquakes
RSOE EDIS
| Date/Time (UTC) | Magnitude | Area | Country | State/Prov./Gov. | Location | Risk | Source | Details | ||
| 28.07.2012 10:25:21 | 3.1 | Europe | Italy | Apulia | San Nicola | EMSC | ||||
| 28.07.2012 10:25:45 | 2.1 | Europe | Romania | Paltin | EMSC | |||||
| 28.07.2012 09:20:28 | 2.6 | North America | United States | California | Ferndale | USGS-RSOE | ||||
| 28.07.2012 09:15:31 | 2.0 | North America | United States | Hawaii | Volcano | USGS-RSOE | ||||
| 28.07.2012 09:25:19 | 2.8 | South-America | Chile | Valparaíso | San Antonio | EMSC | ||||
| 28.07.2012 08:25:26 | 2.2 | Asia | Turkey | Malatya | Doganyol | EMSC | ||||
| 28.07.2012 09:25:45 | 3.9 | North-America | United States | Alaska | Tyonek | EMSC | ||||
| 28.07.2012 08:16:02 | 4.1 | North America | United States | Alaska | Tyonek | USGS-RSOE | ||||
| 28.07.2012 08:16:26 | 4.6 | Asia | India | Uttarakhand | Dharchula | USGS-RSOE | ||||
| 28.07.2012 08:25:48 | 4.6 | Asia | India | Uttarakhand | Dharchula | EMSC | ||||
| 28.07.2012 08:26:10 | 3.1 | South-America | Chile | Antofagasta | Tocopilla | EMSC | ||||
| 28.07.2012 07:35:25 | 2.7 | North America | United States | Nevada | Beatty | USGS-RSOE | ||||
| 28.07.2012 08:26:31 | 2.4 | Asia | Turkey | Bursa | Karacabey | EMSC | ||||
| 28.07.2012 08:26:52 | 4.5 | Middle-East | Yemen | Mu??faz?at Shabwah | Al Hamiyah | EMSC | ||||
| 28.07.2012 07:35:45 | 4.5 | Middle East | Yemen | Mu??faz?at Shabwah | Al Hamiyah | USGS-RSOE | ||||
| 28.07.2012 10:05:27 | 3.6 | North America | United States | Nevada | Crescent Valley | USGS-RSOE | ||||
| 28.07.2012 06:35:29 | 2.7 | North America | United States | Alaska | Akutan | USGS-RSOE | ||||
| 28.07.2012 07:25:26 | 2.2 | North America | United States | Texas | Keene | USGS-RSOE | ||||
| 28.07.2012 05:16:11 | 3.1 | Europe | Greece | Crete | Platanos | EMSC | ||||
| 28.07.2012 06:25:39 | 2.9 | North America | United States | Alaska | Adak | USGS-RSOE | ||||
| 28.07.2012 04:17:00 | 2.3 | North America | United States | California | Westley | USGS-RSOE | ||||
| 28.07.2012 04:15:18 | 2.7 | Europe | Bosnia and Herzegovina | Federation of Bosnia and Herzegovina | Zenica | EMSC | ||||
| 28.07.2012 04:15:36 | 2.0 | Asia | Turkey | ?zmir | Foca | EMSC | ||||
| 28.07.2012 04:16:00 | 3.3 | Asia | Turkey | Antalya | Tekirova | EMSC | ||||
| 28.07.2012 03:35:51 | 2.7 | North America | United States | California | Cabazon | USGS-RSOE | ||||
| 28.07.2012 04:16:20 | 3.4 | Asia | Turkey | Antalya | Tekirova | EMSC | ||||
| 28.07.2012 03:50:33 | 2.6 | Caribbean | U.S. Virgin Islands | Saint Thomas Island | Charlotte Amalie | USGS-RSOE | ||||
| 28.07.2012 03:15:19 | 2.9 | Europe | Bosnia and Herzegovina | Federation of Bosnia and Herzegovina | Zenica | EMSC | ||||
| 28.07.2012 03:15:47 | 3.0 | Asia | Turkey | Bal?kesir | Sindirgi | EMSC | ||||
| 28.07.2012 04:16:38 | 3.0 | Europe | Romania | Gura Teghii | EMSC | |||||
| 28.07.2012 03:16:11 | 2.0 | Europe | Italy | Emilia-Romagna | San Prospero | EMSC | ||||
| 28.07.2012 02:45:23 | 4.2 | Middle America | Guatemala | Escuintla | Pueblo Nuevo Tiquisate | USGS-RSOE | ||||
| 28.07.2012 03:16:33 | 4.2 | Middle-America | Guatemala | Escuintla | Pueblo Nuevo Tiquisate | EMSC | ||||
| 28.07.2012 02:10:21 | 4.2 | Europe | Bosnia and Herzegovina | Federation of Bosnia and Herzegovina | Zenica | EMSC | ||||
| 28.07.2012 01:50:54 | 3.8 | Pacific Ocean | New Zealand | Canterbury | Kaiapoi | GEONET | ||||
| 28.07.2012 02:10:42 | 4.7 | Europe | Bosnia and Herzegovina | Federation of Bosnia and Herzegovina | Zenica | EMSC | ||||
| 28.07.2012 01:30:28 | 4.6 | Europe | Bosnia and Herzegovina | Federation of Bosnia and Herzegovina | Zenica | USGS-RSOE | ||||
| 28.07.2012 02:11:01 | 2.8 | Asia | Turkey | Isparta | Anamas | EMSC | ||||
| 28.07.2012 01:10:20 | 2.8 | Europe | Greece | North Aegean | Eresos | EMSC | ||||
| 28.07.2012 00:05:20 | 2.2 | Europe | Italy | Campania | Montoro Superiore | EMSC | ||||
| 28.07.2012 00:05:42 | 4.1 | Middle-East | Iran | M?zandar?n | Tonekabon | EMSC | ||||
| 28.07.2012 00:20:30 | 4.4 | Middle East | Iran | M?zandar?n | Chalus | USGS-RSOE | ||||
| 28.07.2012 00:06:09 | 4.6 | Asia | China | Sichuan | Leshan | EMSC | ||||
| 28.07.2012 00:07:40 | 4.6 | Asia | China | Sichuan | Leshan | USGS-RSOE | ||||
| 28.07.2012 00:00:39 | 4.2 | Middle East | Iran | M?zandar?n | Chalus | USGS-RSOE | ||||
| 28.07.2012 00:06:31 | 4.2 | Middle-East | Iran | M?zandar?n | Chalus | EMSC | ||||
| 27.07.2012 23:20:29 | 2.1 | North America | United States | California | Mountain Gate | USGS-RSOE | ||||
| 28.07.2012 00:06:52 | 3.1 | Asia | Turkey | Bursa | Karacabey | EMSC | ||||
| 27.07.2012 23:15:56 | 2.6 | North America | United States | Hawaii | Volcano | USGS-RSOE | ||||
| 27.07.2012 21:35:40 | 2.1 | North America | United States | Alaska | Nanwalek | USGS-RSOE |
**********************************************************************************************************
Volcanic Activity
Fuego volcano (Guatemala), activity update: strombolian activity and lava flows
BY: T
Weak but frequent explosions occur at Fuego volcano in Guatemala. On
25-26 July, they were producing gray ash columns reaching heights of 300
m to 600 m, and drifting up to 12 km west, northwest and southwest.
The explosions ejected incandescent material to heights of 100 to 150 m
above the crater and generated weak avalanches on the upper crater
flanks with rumbling and jetting sounds. Weak glow is seen at the crater
at night.
The lava flow toward Taniluyá canyon reaches 400 meters in length. A new
lava flow is active toward Ceniza (“ash”) Canyon and has reached 200 m
length, and from both flows, glowing lava blocks roll down the flanks
and reach the vegetation. A third lava flow was observed in the
direction of the Lajas Canyon with a length of 600 m.
Weak avalanches from the summit area were directed toward Canyon Santa
Teresa and reached about 300 m distance and lifted up light ash clouds.
***********************************************************************************************************
Extreme Temperatures/ Weather
Excessive Heat Warning
TULSA OK
Heat Advisory
SPRINGFIELD MO
TOPEKA KS
KANSAS CITY/PLEASANT HILL MO
NORMAN OK
FORT WORTH TX
WICHITA KS
TULSA OK
| 27.07.2012 | Heat Wave | Japan | [Statewide] |
Heat Wave in Japan on Wednesday, 25 July, 2012 at 03:36 (03:36 AM) UTC.
| Description | |
| The number of people taken to hospitals by ambulance due to heatstroke in the week through Sunday more than doubled from the preceding week to 5,467, preliminary data showed Tuesday. The figure, up from 2,622 in the week to July 15, hit the highest for a single week this summer, according to the data released by the Fire and Disaster Management Agency. Deaths caused by heatstroke increased to 13 from five in the preceding week. Tokyo and Saitama Prefecture had the most victims, with ambulances called for 388 people each. They were followed by 382 in Aichi Prefecture and 372 in Osaka Prefecture. People aged 65 or older accounted for 45.9 percent of the total. Since the agency started this year’s survey on May 28, 11,116 people were taken to hospitals as of Sunday. Twenty-three people have died. The rise in heatstroke cases reflects the smothering heat wave, with temperatures of 35 degrees or higher observed in many places for the four days from July 16, agency officials said. In Tatebayashi, Gunma Prefecture, the mercury shot up to 37.6 on July 16 and to 39.2 the following day, according to the Meteorological Agency. |
Abnormal Heat, Strong Winds Feed Siberian Forest Fire
Published on Jul 27, 2012 by IBTimesTV
Abnormal heat and strong winds have firefighters
working overtime in Tomsk, Siberia this week where they are still
battling blazes that have now spread over 15,000 hectares of Russian
forests.
Thick smog from the fire has forced the local airport to close, delaying travelers with flight cancellations.Firefighters are using helicopters to dump water on the fire because this summer broke 170 year old records for heat and dryness.
With temperatures over 90 degrees and without any precipitation in the forecast the job won’t be getting any easier for those firefighters.
Mandatory evacuations ordered on Skibstad fire

PAUL RUHTER/Gazette Staff
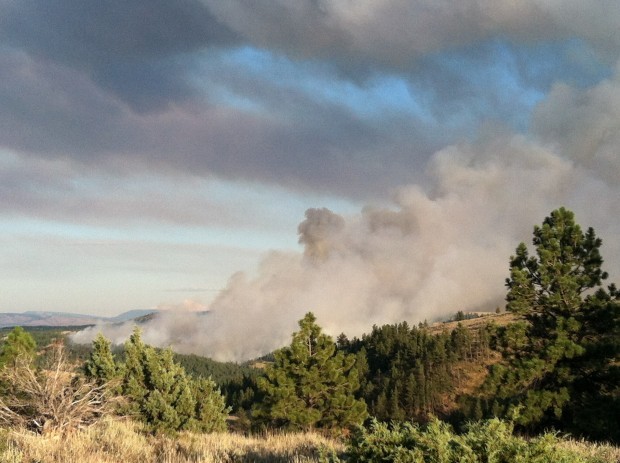
The Skibstad Fire burns southeast of Columbus on Wednesday, July 25, 2012.
The Skibstad Fire burns southeast of Columbus on Wednesday, July 25, 2012.
BILLINGS – Mandatory evacuations were ordered Thursday for residents
of 20 to 30 houses in south-central Montana after a 5-square-mile
wildfire surged toward a rural subdivision.
The order from Stillwater County commissioners covered the Hermit Creek subdivision and a five-mile stretch of Shane Creek Road south of Columbus.
Firefighters made some progress Thursday on the back end of the Skibstad, reporting that it was 35 percent contained by late afternoon. But on the fire’s leading edge, a steady breeze was pushing the blaze toward houses.
“That north and northeast portion up by the homes is a lot of concern,” said Paula Short with the state Department of Natural Resources and Conservation.
A shelter for evacuees was set up at Columbus High School.
As flames approached within a couple miles of his property on Shane Creek Road, Shane Fouhy said he was packing some belongings, setting out sprinklers to water down his house and yard and heading into Columbus to stay with relatives.
“I’ve been out all morning watering and the wind is kind of whirling,” he said. “It’s burning in all directions.”
Some structures were confirmed burned; how many and whether any were houses remained unclear. No injuries have been reported.
Residents of dozens more houses were put on notice that they, too, might have to go. State officials say there are 124 homes in the area.
Barb Marshall, who lives on Shane Creek Road several miles outside the area under mandatory evacuation, was keeping a close eye on the smoke plumes billowing up to the south.
“I’ve got my rig loaded and I’m ready to go,” she said.
The fire started Wednesday evening in a secondary building on Skibstad Road and quickly spread across the surrounding landscape. Pushed south by the wind through timber, grass and sage brush, it reached into areas of Carbon County.
Prior to the mandatory order, county workers and firefighters went door to door asking people to leave voluntarily.
A heavy air tanker and several smaller aircraft were providing support to at least 60 firefighters with more personnel en route, Short said.
A federal incident management team was to take over the battle against the fire.
Elsewhere in Montana, the Wolf Creek fire north of Winnett grew to more than 9 square miles but was 70 percent contained Thursday afternoon, The Great Falls Tribune reported. The lightning-caused fire had threatened five houses and 10 outbuildings.
The nearby 15 Mile fire that began Wednesday had burned 1,350 acres, the paper reported. No structures were threatened.
In western Montana, the 5-square-mile Mission Road fire was reported to be 80 percent contained.
Near Lincoln, officials said a three-story lodge destroyed in a 43-acre fire that started Tuesday in the Roger’s Pass area was worth an estimated $3 million, according to the Helena Independent Record. The cause of that blaze, known as Joe’s Mountain fire, was under investigation.
Gov. Brian Schweitzer Thursday asked President Barack Obama to declare a disaster area for parts of southeast Montana with damage from the Ash Creek Fire.
If the request is granted it could make federal aid available to restore public infrastructure damaged by the fire, which burned 390 square miles in Powder River and Rosebud counties and on the Northern Cheyenne Indian Reservation.
Public damages in those areas is estimated at $1.6 million. Most of that was to Tongue River Electric Co-op infrastructure. Schweitzer says he also has requested the Small Business Administration complete a damage assessment.
More than 925 wildfires have burned a combined 732 square miles across Montana so far in 2012. That’s well above the 530-square-mile annual average over the past decade.
About two-thirds of this year’s fires have been human caused. However, fires caused by lightning account for the bulk of the acreage burned.
Extreme Fire Danger
HASTINGS NE
Storms / Flooding
| Active tropical storm system(s) | ||||||||||
 |
||||||||||
| Name of storm system | Location | Formed | Last update | Last category | Course | Wind Speed | Gust | Wave | Source | Details |
| 10W | Pacific Ocean | 28.07.2012 | 28.07.2012 | Tropical Depression | 325 ° | 46 km/h | 65 km/h | 4.27 m | JTWC | |
Tropical Storm data
|
|||||||||||||||||||||||||||||||||||||||||||||||||||||||||||||||||||||||||||||||||||||||||||||||||||||||||||||||||||||||||
|
|||||||||||||||||||||||||||||||||||||||||||||||||||||||||||||||||||||||||||||||||||||||||||||||||||||||||||||||||||||||||
Flights Canceled, Power Disrupted As Storms Wreak Havoc In US Northeast (PHOTOS)
By Amrutha Gayathri: Subscribe to Amrutha Gayathri’s RSS feed
Flights Canceled, Power Disrupted As Storms Wreak Havoc In US Northeast (PHOTOS)
Storms hit the U.S. Northeast Thursday, leaving at least one person dead and knocking out power to hundreds of thousands of residents.About 900 flights have been canceled due to bad weather. New York’s LaGuardia Airport reported the maximum number of cancellations, with 162 flights grounded while many flights were delayed at airports in Chicago, Philadelphia, Washington, DC, Baltimore and Boston, the Federal Aviation Administration said.
Severe thunderstorms accompanied by heavy downpour are expected to hit the Midwest, New York City and the Northeast Friday, forecasters have said.
The National Weather Service issued thunderstorm warnings in Delaware, Maryland, New Jersey, Kentucky, Virginia, Arkansas and several other points that lie in between.
In Pennsylvania, a woman died in her car, which was crushed under a tree, according to CNN.
“The risk for widespread damaging winds will increase from midday to mid-afternoon from Indiana and Ohio across Pennsylvania, southeast New York, into western Massachusetts and Connecticut,” the U.S. Storm Prediction Center in Norman, Okla., said.
The weather service has warned of possible tornadoes ripping through Elmira, N.Y., and Brookville, Pa.
DAY28: America’s infrastructure takes another hit from 2nd apocalyptic ‘derecho’ superstorm
Published on Jul 27, 2012 by N0LINKNEWS
The ‘Great Derecho’ Exposed Old Grids
By MoneyShow.com Jul 24, 2012 3:30 pm
The power is back up (for the most part) after the storm that swept down on the mid-Atlantic states in early July. Now utilities are going to have to calculate what it cost them.
The Great Derecho of 2012 knocked out power to 4.3 million people
over 10 Midwest and Middle Atlantic states. The toll in human lives and
property damage has yet to be fully counted.By MoneyShow.com Jul 24, 2012 3:30 pm
The power is back up (for the most part) after the storm that swept down on the mid-Atlantic states in early July. Now utilities are going to have to calculate what it cost them.
Hurricanes typically take days to form at sea. That gives first responders, utilities and government agencies in threatened areas time to prepare for damage control. In contrast, the Great Derecho came with hurricane-force winds virtually without warning. Recovery plans had to be made on the fly, in some cases with emergency communications networks out of service.
The longer the outage, the greater the cost incurred by utilities. The storm’s intensity is a clear warning we’ve entered a period of greater extremes, with increased stresses on basic systems, particularly electricity.
http://tinyurl.com/cr93fuy
Weather Extremes Leave Parts of U.S. Grid Buckling
Travis Long/The News & Observer, via Associated Press
By MATTHEW L. WALD and JOHN SCHWARTZ
Published: July 25, 2012
Some utilities are re-examining long-held views on the economics of protecting against the weather. Pepco, the utility serving the area around Washington, has repeatedly studied the idea of burying more power lines, and the company and its regulators have always decided that the cost outweighed the benefit. But the company has had five storms in the last two and a half years for which recovery took at least five days, and after the derecho last month, the consensus has changed. Both the District of Columbia and Montgomery County, Md., have held hearings to discuss the option — though in the District alone, the cost would be $1.1 billion to $5.8 billion, depending on how many of the power lines were put underground.
Even without storms, heat waves are changing the pattern of electricity use, raising peak demand higher than ever. That implies the need for new investment in generating stations, transmission lines and local distribution lines that will be used at full capacity for only a few hundred hours a year. “We build the system for the 10 percent of the time we need it,” said Mark Gabriel, a senior vice president of Black & Veatch, an engineering firm. And that 10 percent is “getting more extreme.”
Even as the effects of weather extremes become more evident, precisely how to react is still largely an open question, said David Behar, the climate program director for the San Francisco Public Utilities Commission. “We’re living in an era of assessment, not yet in an area of adaptation,” he said.
He says that violent storms and forest fires can be expected to affect water quality and water use: runoff from major storms and falling ash could temporarily shut down reservoirs. Deciding how to address such issues is the work of groups like the Water Utility Climate Alliance, of which he is a member. “In some ways, the science is still catching up with the need of water managers for high-quality projection,” he said.
Some needs are already known. San Francisco will spend as much as $40 million to modify discharge pipes for treated wastewater to prevent bay water from flowing back into the system.
http://tinyurl.com/dylfga5
Flash Flood Watch
ALBUQUERQUE NM
TAUNTON MA
ALBANY NY
Flood Advisory
JUNEAU AK
| Today | Flood | Greenland | Municipality of Qeqqata, Kangerlussuaq [Watson River] |
Flood in Greenland on Saturday, 28 July, 2012 at 03:16 (03:16 AM) UTC.
| Description | |
| Melting ice in Greenland has swelled the island’s rivers with water. A NASA satellite snapped a photo of meltwater overflowing the banks of the Watson River near Kangerlussuaq, a key air transportation hub, on July 12. Two weeks later, however, river levels have receded somewhat, according to a release from the NASA Earth Observatory. “Water rises every year, but I’ve never before observed it at this level of discharge,” said Richard Forster, a University of Utah researcher who has done extensive fieldwork in Greenland, in a statement. “It was also about two weeks prior to the normal seasonal peak.” The town, known as Kanger, hosts one of the island’s busiest commercial airports and is a frequent departure point for scientific research flights. It lies about 74 miles (125 kilometers) from the sea. The water most likely came from melting of the ice sheet – rather than an ice-dammed lake bursting or glacial lake drainage – as the high discharge was maintained for so long, Forster said. The flooding follows reports that 97 percent of Greenland’s ice sheets thawed on the surface, according to satellite measurements. Only four days before, just 40 percent of the surface ice layer was thawing.This year’s ice melt is well above average: About half of Greenland’s surface ice tends to melt every summer, with the meltwater at higher elevations quickly refreezing in place and the coastal meltwater either pooling on top of the ice or draining into the sea. The massive melt may have been caused by a ridge or dome of warm air hovering over Greenland. Signs of ice melt were even found around Summit Station in central Greenland, which at 2 miles (3.2 kilometers) above sea level is near to the highest point on the ice sheet. The melting characteristics of such a huge ice sheet – spanning 656,000 square miles (1.7 million square kilometers) – is important for various reasons, particularly its potential effect on sea levels. If melted completely, the Greenland ice sheet could contribute 23 feet (7 meters) to global sea-level rise, according to a 2007 report by the Intergovernmental Panel on Climate Change, the international body charged with assessing climate change. Whether or not this recent massive melt will affect the overall ice loss this summer, and as such bump up sea level, is still an open question. In other Greenland-melting news, a massive iceberg that recently broke away from one of Greenland’s largest glaciers is making its way downstream and toward the open ocean, as shown by a new satellite photo. The drifting island of ice split from the Petermann Glacier’s ice shelf – the front end of a glacier, which hangs off the land and floats on the ocean. Thenewly birthed berg is estimated to be about 46 square miles (120 square kilometers), and finally broke away from the floating tongue of ice on Monday, July 16. |
Epidemic Hazards / Diseases
| Today | Epidemic Hazard | USA | State of Florida, [Wild Africa Trek at Walt Disney World’s Animal Kingdom] |
Epidemic Hazard in USA on Saturday, 28 July, 2012 at 03:37 (03:37 AM) UTC.
| Description | |
| Numerous people have reported contracting an unknown illness after visiting the Wild Africa Trek at Walt Disney World’s Animal Kingdom. According to the Orange County, FL Health Department, hundreds of people have been questioned in connection to flu-like symptoms which were first detected in June. People reported experiencing diarrhea, nausea, fatigue and abdominal pain after taking the site’s three-hour tour, which includes hikes, animal sightings and a foot bridge crossing. “The thing we’re trying to get everyone to understand is this is some kind of stomach bug,” said Health Department spokesman Dain Weister. No specific pathogen has been identified. One guest who became ill posted his experience on the DIS boards. He said he became ill within 24 hours and went to the emergency room. Inspectors were sent to Animal Kingdom to examine its food preparation areas. “Two of those inspections showed no problems, no health violations,” Weister said. “The inspection was satisfactory.” Disney officials stated that increased measures have been taken to promote hand-washing and hand sanitizer use. “We are working closely with the Orange County Health Department to review the situation,” said Disney spokeswoman Andrea Finger. No other areas of Disney World have been affected. | |
| Biohazard name: | Unidentified illness |
| Biohazard level: | 3/4 Hight |
| Biohazard desc.: | Bacteria and viruses that can cause severe to fatal disease in humans, but for which vaccines or other treatments exist, such as anthrax, West Nile virus, Venezuelan equine encephalitis, SARS virus, variola virus (smallpox), tuberculosis, typhus, Rift Valley fever, Rocky Mountain spotted fever, yellow fever, and malaria. Among parasites Plasmodium falciparum, which causes Malaria, and Trypanosoma cruzi, which causes trypanosomiasis, also come under this level. |
| Symptoms: | flu-like symptoms |
| Status: | confirmed |
| Today | Epidemic Hazard | Zimbabwe | Multiple areas, [Harare (Capital City) and Chitungwiza] |
Epidemic Hazard in Zimbabwe on Saturday, 28 July, 2012 at 03:34 (03:34 AM) UTC.
| Description | |
| More than 100 people in the Zimbabwean capital Harare and Chitungwiza, a dormitory town 35km southeast of the city, have contracted typhoid this month, and the dilapidated water and sanitation systems are again being blamed for another round of water-borne diseases. According to health officials cited in the local media, 83 cases of typhoid have been confirmed in Chitungwiza and a further 28 in Harare, of which 25 were linked to a supermarket in the Avenues area of the city centre. Portia Manangazira, the chief disease control officer in the Health Ministry, told IRIN that in June 22 cases of suspected cholera, 10 of which were confirmed, were reported in Chiredzi – a town in Masvingo Province close to neighbouring South Africa – and one confirmed case of cholera was reported in Manicaland Province, which borders Mozambique. “We are monitoring the situation very closely to make sure the cholera does not spread. The health sector is on high alert,” she said. A year-long outbreak of cholera in 2008 killed more than 4,000 people and infected about 100,000 others and since then there have been regular outbreaks of waterborne diseases in both urban and rural areas. In January 2012 about 900 Harare residents were diagnosed with typhoid, but no fatalities were recorded. | |
| Biohazard name: | Cholera Outbreak |
| Biohazard level: | 2/4 Medium |
| Biohazard desc.: | Bacteria and viruses that cause only mild disease to humans, or are difficult to contract via aerosol in a lab setting, such as hepatitis A, B, and C, influenza A, Lyme disease, salmonella, mumps, measles, scrapie, dengue fever, and HIV. “Routine diagnostic work with clinical specimens can be done safely at Biosafety Level 2, using Biosafety Level 2 practices and procedures. Research work (including co-cultivation, virus replication studies, or manipulations involving concentrated virus) can be done in a BSL-2 (P2) facility, using BSL-3 practices and procedures. Virus production activities, including virus concentrations, require a BSL-3 (P3) facility and use of BSL-3 practices and procedures”, see Recommended Biosafety Levels for Infectious Agents. |
| Symptoms: | |
| Status: | suspected |
Climate Change
Extreme weather: Get ready to see more of it, scientists say
By Moni Basu, CNN
 Fatima
Domingpe applies sunscreen to her face near the Mosaic Fountain in
downtown Silver Spring, Maryland, on Saturday, July 7. A record heat
wave has been in the area for more than a week.
Fatima
Domingpe applies sunscreen to her face near the Mosaic Fountain in
downtown Silver Spring, Maryland, on Saturday, July 7. A record heat
wave has been in the area for more than a week.
STORY HIGHLIGHTS
- The United States experienced its warmest 12 months on record
- A new report Tuesday says 2011 will be remembered as the year of extreme weather
- One scientist says climate change increases the chances of more such weather
- There’s debate over how climate change affects weather patterns
Why to expect more weather disasters
That followed a warm winter and early season droughts. News came Monday that the mainland United States experienced its warmest 12 months since the dawn of record-keeping in 1895.
And on Tuesday, the National Oceanic and Atmospheric Administration (NOAA) released a report calling 2011 a year of extreme weather.
Wildfire victims face second tragedy
Remember Hurricane Irene? Or the floods in Thailand and southern China and the deadly drought in the Horn of Africa? Heavy rains in Brazil caused massive landslides and much of Europe suffered through a sweltering heatwave.
It’s tempting to simplify things and blame it all on global warming.
After all, nine of the top 10 warmest years globally have occurred since 2000, according to NOAA.
But weather can be complicated.
The real challenge is figuring out whether a particular storm or flood was due to climate change or natural variables, said Chris Field, founding director of the Carnegie Institution’s Department of Global Ecology.
The NOAA report, for instance, noted some events that were exacerbated by other factors. However, climate change increases global risks, Field said.
“As we change the climate, we’re shifting the odds for extreme weather,” he said.
Photos: Extreme heat strikes U.S.
It’s sort of like upping your chances of a car accident if you’re speeding.
The four classes of extremes — high heat, heavy precipitation and floods, duration and intensity of droughts and extremes related to higher sea levels — have changed in the last 50 years, Field said.
“Increasingly, we are loading the dice towards these very damaging kinds of extremes,” he said.
But that’s not to say every weather event is related to warming temperatures.
Southern Greenland, northern Russia, and the eastern two-thirds of North America have felt the greatest warmth in 2012, but many places — Alaska, Mongolia and most of Australia — have been cool anomalies.
Russia declares day of mourning for flood victims
The men’s final at the Wimbledon tennis tournament Sunday was stopped briefly for rain. Rain, in Britain? Although it has a reputation for sogginess, it’s been cooler and wetter than normal for the last few months in the British isles.
America’s northwest has also escaped the heat. The state of Washington just marked its seventh coolest June ever.
“When you’ve got a planet that’s nearest warmest levels on record, that doesn’t mean every part of the world is going to be the warmest ever,” said Jeff Masters, director of meteorology for Weather Underground.
“The U.S. has been unlucky enough to be in that sort of pattern,” he said.
Jake Crouch, a climate scientist at the National Climatic Data Center, said weather patterns — including the jet stream or the ocean-atmosphere systems in the Pacific known as El Niño and La Niña — have a great effect on weather.
In 2011, two back-to-back La Niñas, each characterized by cooler-than-average water temperatures in the eastern Pacific, affected significant weather events — including droughts in the southern United States and northern Mexico and in east Africa.
There is debate over how climate change affects such weather patterns but the NOAA-led “state of the climate” report said La Niña-related heat waves are now 20 times more likely to occur than 50 years ago.
Scientists also analyzed the United Kingdom’s very warm November 2011 and a very cold December 2010. They said that cold Decembers are now half as likely to occur versus 50 years ago, whereas warm Novembers are now 62 times more likely.
The report pointed out that some weather events, like the Thailand flooding, are influenced by humans in other ways.
Photos: Finding beauty in violent storms
“Although the flooding was unprecedented, the amount of rain that fell in the river ‘catchment’ area was not very unusual,” the report said. “Other factors, such as changes in reservoir policies and increased construction on the flood plain, were found most relevant in setting the scale of the disaster.”
The 2012 hurricane season has gotten off to a robust start, though meteorologist Thomas Downs of Expert Weather Investigations attributed that to a cyclical warming of Atlantic waters.
“We’ve had a tremendous start to the system. We are in the middle of a warm phase,” he said.
Hurricane Andrew in 1992 was devastating, but it was also the first named storm of that year — in August.
By contrast, this year, the United States has already lived through four named storms — two in May and two in June. The last was Tropical Storm Debby, which flooded Florida.
The warmer waters can lead to warmer temperatures on land, Downs said. So can extended drought.
“The biggest thing of this year is the cumulative effect of the last two seasons. Some parts of the United States have been under drought conditions for the past two years,” he said, and did not have much rain in April and May. Less solar energy is absorbed by hot, parched land.
“The drought amplifies temperatures — 90 becomes 100. 100 becomes 105.”
“The reality is when you do have extreme weather, it is highlighted,” Downs said. “People want to attribute it to one factor or another.”
The other reality is that Americans and others will likely be paying a lot more for cereal, sweeteners and meat as the price of corn goes up because of failed crops.
“The crops are hurting,” said Chad Hart, a grain market specialist at Iowa State University.
The eastern part of the Corn Belt is especially hard-hit. In states like Iowa, farmers are in the critical stage of corn pollination.
“We need a good inch of moisture this week,” Hart said. “And there’s no rain in the forecast.
“That means we are looking for a much lower yield for crops we produce in the Midwest.”
Read Full Article Here
************************************************************************************************************
Solar Activity
3MIN News July 27, 2012
Published on Jul 27, 2012 by Suspicious0bservers
EARTHQUAKE WATCH: http://youtu.be/SMiHsOYwdCsTODAY’S LINKS
UV Southern Hemisphere: http://phys.org/news/2012-07-ozone-hole-uv-impacting-marine.html
REPEAT LINKS
Spaceweather: http://spaceweather.com/ [Look on the left at the X-ray Flux and Solar Wind Speed/Density]
HAARP: http://www.haarp.alaska.edu/haarp/data.html [Click online data, and have a little fun]
SDO: http://sdo.gsfc.nasa.gov/data/ [Place to find Solar Images and Videos - as seen from earth]
SOHO: http://sohodata.nascom.nasa.gov/cgi-bin/soho_movie_theater [SOHO; Lasco and EIT - as seen from earth]
Stereo: http://stereo.gsfc.nasa.gov/cgi-bin/images [Stereo; Cor, EUVI, HI - as seen from the side]
SunAEON:http://www.sunaeon.com/#/solarsystem/ [Just click it... trust me]
SOLARIMG: http://solarimg.org/artis/ [All purpose data viewing site]
iSWA: http://iswa.gsfc.nasa.gov/iswa/iSWA.html [Free Application; for advanced sun watchers]
NOAA ENLIL SPIRAL: http://www.swpc.noaa.gov/wsa-enlil/cme-based/ [CME Evolution]
NOAA Bouys: http://www.ndbc.noaa.gov/
RSOE: http://hisz.rsoe.hu/alertmap/index2.php [That cool alert map I use]
JAPAN Radiation Map: http://jciv.iidj.net/map/
LISS: http://earthquake.usgs.gov/monitoring/operations/heliplots_gsn.php
Gamma Ray Bursts: http://grb.sonoma.edu/ [Really? You can't figure out what this one is for?]
BARTOL Cosmic Rays: http://neutronm.bartol.udel.edu//spaceweather/welcome.html [Top left box, look for BIG blue circles]
TORCON: http://www.weather.com/news/tornado-torcon-index [Tornado Forecast for the day]
GOES Weather: http://rsd.gsfc.nasa.gov/goes/ [Clouds over America]
INTELLICAST: http://www.intellicast.com/ [Weather site used by many youtubers]
NASA News: http://science.nasa.gov/science-news/science-at-nasa/
************************************************************************************************************
Space
Earth approaching objects (objects that are known in the next 30 days) |
|||||||||
|
|||||||||
| Object Name | Apporach Date | Left | AU Distance | LD Distance | Estimated Diameter* | Relative Velocity | |||
| (2009 PC) | 28th July 2012 | 0 day(s) | 0.1772 | 68.9 | 61 m – 140 m | 7.34 km/s | 26424 km/h | ||
| 217013 (2001 AA50) | 31st July 2012 | 3 day(s) | 0.1355 | 52.7 | 580 m – 1.3 km | 22.15 km/s | 79740 km/h | ||
| (2012 DS30) | 02nd August 2012 | 5 day(s) | 0.1224 | 47.6 | 18 m – 39 m | 5.39 km/s | 19404 km/h | ||
| (2000 RN77) | 03rd August 2012 | 6 day(s) | 0.1955 | 76.1 | 410 m – 920 m | 9.87 km/s | 35532 km/h | ||
| (2004 SB56) | 04th August 2012 | 7 day(s) | 0.1393 | 54.2 | 380 m – 840 m | 13.72 km/s | 49392 km/h | ||
| (2000 SD8) | 04th August 2012 | 7 day(s) | 0.1675 | 65.2 | 180 m – 400 m | 5.82 km/s | 20952 km/h | ||
| (2006 EC) | 06th August 2012 | 9 day(s) | 0.0932 | 36.3 | 13 m – 28 m | 6.13 km/s | 22068 km/h | ||
| (2006 MV1) | 07th August 2012 | 10 day(s) | 0.0612 | 23.8 | 12 m – 28 m | 4.79 km/s | 17244 km/h | ||
| (2005 RK3) | 08th August 2012 | 11 day(s) | 0.1843 | 71.7 | 52 m – 120 m | 8.27 km/s | 29772 km/h | ||
| (2009 BW2) | 09th August 2012 | 12 day(s) | 0.0337 | 13.1 | 25 m – 56 m | 5.27 km/s | 18972 km/h | ||
| 277475 (2005 WK4) | 09th August 2012 | 12 day(s) | 0.1283 | 49.9 | 260 m – 580 m | 6.18 km/s | 22248 km/h | ||
| (2004 SC56) | 09th August 2012 | 12 day(s) | 0.0811 | 31.6 | 74 m – 170 m | 10.57 km/s | 38052 km/h | ||
| (2008 AF4) | 10th August 2012 | 13 day(s) | 0.1936 | 75.3 | 310 m – 690 m | 16.05 km/s | 57780 km/h | ||
| 37655 Illapa | 12th August 2012 | 15 day(s) | 0.0951 | 37.0 | 770 m – 1.7 km | 28.73 km/s | 103428 km/h | ||
| (2012 HS15) | 14th August 2012 | 17 day(s) | 0.1803 | 70.2 | 220 m – 490 m | 11.54 km/s | 41544 km/h | ||
| 4581 Asclepius | 16th August 2012 | 19 day(s) | 0.1079 | 42.0 | 220 m – 490 m | 13.48 km/s | 48528 km/h | ||
| (2008 TC4) | 18th August 2012 | 21 day(s) | 0.1937 | 75.4 | 140 m – 300 m | 17.34 km/s | 62424 km/h | ||
| (2006 CV) | 20th August 2012 | 23 day(s) | 0.1744 | 67.9 | 290 m – 640 m | 13.24 km/s | 47664 km/h | ||
| (2012 EC) | 20th August 2012 | 23 day(s) | 0.0815 | 31.7 | 56 m – 130 m | 5.57 km/s | 20052 km/h | ||
| 162421 (2000 ET70) | 21st August 2012 | 24 day(s) | 0.1503 | 58.5 | 640 m – 1.4 km | 12.92 km/s | 46512 km/h | ||
| (2007 WU3) | 21st August 2012 | 24 day(s) | 0.1954 | 76.0 | 56 m – 120 m | 5.25 km/s | 18900 km/h | ||
| (2012 BB14) | 24th August 2012 | 27 day(s) | 0.1234 | 48.0 | 27 m – 60 m | 2.58 km/s | 9288 km/h | ||
|
|||||||||
Biological Hazards / Wildlife / Hazmat
| Today | Biological Hazard | USA | State of Colorado, Pueblo |
Biological Hazard in USA on Saturday, 28 July, 2012 at 03:32 (03:32 AM) UTC.
| Description | |
| Public Health officials announced Friday that a rabbit tested positive for an illness that “is similar to plague” in Pueblo. The rabbit was found in Pueblo West in the 1000 Block of West Saginaw Drive, and tested positive for Tularemia. Though the bacterial illness occurs naturally in the U.S., it’s a condition that can be fatal to humans. “Tularemia is similar to plague,” Heather Maio, director of the Environmental Health Division at the Pueblo City-County Health department, said. “It can be passed to humans or animals through the bite of infected insects – most commonly ticks and deer flies – and by handling infected, sick, or dead animals.” The disease can also be passed to people or animals if they eat meat or drink water infected by the bacteria. It cannot, however, be passed from person to person. Tularemia symptoms typically occur within 3-5 days after exposure and include sudden fever, headaches, diarrhea, muscle aches, dry cough and progressive weakness. The disease is fatal, Public Health officials said, if not treated with the right antibiotics. Ticks in the area may pose the biggest threat to humans, so Public Health officials are advising locals and their pets to steer clear of heavily wooded areas where ticks thrive. | |
| Biohazard name: | Tularemia (rabbit) |
| Biohazard level: | 3/4 Hight |
| Biohazard desc.: | Bacteria and viruses that can cause severe to fatal disease in humans, but for which vaccines or other treatments exist, such as anthrax, West Nile virus, Venezuelan equine encephalitis, SARS virus, variola virus (smallpox), tuberculosis, typhus, Rift Valley fever, Rocky Mountain spotted fever, yellow fever, and malaria. Among parasites Plasmodium falciparum, which causes Malaria, and Trypanosoma cruzi, which causes trypanosomiasis, also come under this level. |
| Symptoms: | |
| Status: | confirmed |
| Today | HAZMAT | China | Province of Zhejiang Sheng, Hangzhou |
HAZMAT in China on Saturday, 28 July, 2012 at 04:49 (04:49 AM) UTC.
| Description | |
| Chinese state media say a toxic gas leak caused by chemicals used nine years ago to combat the SARS epidemic has forced more than 800 workers to evacuate from a downtown office building in east China’s Hangzhou city. The gas came from a stockpile of chlorine dioxide powder. It was used as a disinfectant in 2003 during the SARS scare but was never disposed of. White smog filled the 19th floor of the building on Friday morning, causing panic. |
Articles of Interest
| Today | Technological Disaster | India | State of Uttar Pradesh, Bijnor [Ramanand Public High School] |
Technological Disaster in India on Saturday, 28 July, 2012 at 03:20 (03:20 AM) UTC.
| Description | |
| At least eight children were killed and 18 injured when the roof of a private school collapsed in Bijnor district of Uttar Pradesh on Friday afternoon. At least 30 children were in the classroom when the slab of the verandah on the first floor collapsed. District magistrate of Bijnor Sarika Mohan, however, said only six children have died in the accident and seven others sustained serious injuries .The injured have been admitted to the district hospital. Ramanand Public High School, a privately owned school, is located in the Zameerpur village, Chandpur town, Bijnor. The roof of the class room collapsed when about 30 students were in class. The children were all in Class V, aged between 10 and 13 years. “Prima facie it’s a case of negligence by the owner of the school. I have ordered a detailed inquiry into the incident and a FIR is being lodged against the owner of the school Rishipal Singh,” said Mohan. “Five children were declared brought dead by doctors and 18 kids have been admitted to various hospitals. Some of the injured are in serious condition. The rescue work is still in progress and we hope that there is no one left in the debris,” Mohan told media persons. The management and staff of the school fled after the incident and police teams have been deployed to search for them, she added. “I have also ordered an inquiry in to incident,” she added. Locals and villagers started the rescue operation, and by the time help reached, they had already rescued about a dozen kids. They were rushed to nearby nursing homes and primary health centres for treatment. The villagers also alleged that help reached them several hours after the incident took place and by that time they had rescued most of the children trapped inside. The parents and locals also shouted slogans and gheraoed senior officials of the district administration. They were pacified after the administration promised compensation and strict action against those found guilty of negligence. The district magistrate said a proposal for the compensation will be sent to the government. |
[In accordance with Title 17 U.S.C. Section 107, this material is distributed without profit, for research and/or educational purposes. This constitutes 'FAIR USE' of any such copyrighted material.]
No comments:
Post a Comment
Hello and thank you for visiting my blog. Please share your thoughts and leave a comment :)