Showing posts with label Great Recession. Show all posts

Tuesday, December 8, 2015

Researchers at both JP Morgan and Citigroup agree that the probability that the U.S. economy will soon plunge into recession is rising.


The Economic Collapse
Are You Prepared For The Coming Economic Collapse And The Next Great Depression?

JP Morgan And Citigroup Agree That The U.S. Economy Is Steamrolling Toward A Recession

Locomotive - Public Domain


As we approach the end of 2015, researchers at both JP Morgan and Citigroup agree that the probability that the U.S. economy will soon plunge into recession is rising.  Just last week, a member of the U.S. House of Representatives asked Janet Yellen about Citigroup’s assessment that there is a 65 percent chance that the United States will experience an economic recession in 2016.  You can read her answer below.  And just a few days ago, JP Morgan economists Michael Feroli, Daniel Silver, Jesse Edgerton, and Robert Mellman released a report in which they declared that “the probability of recession within three years” has risen to “an eye-catching 76%”
“Our longer-run indicators, however, continue to suggest an elevated risk that the expansion is nearing its end, and our preferred model now puts the probability of recession within three years at an eye-catching 76%.”
The good news is that the economists at JP Morgan believe that a recession will probably not hit us within the next six months.  But due to steadily weakening economic conditions, they are convinced that one is almost certain to strike within the next few years
“When we first wrote, only manufacturing sentiment was signaling an above-average probability of imminent recession,” they said. “But recent weakening in the Richmond Fed services survey and the ISM nonmanufacturing index have now pushed the nonmanufacturing sentiment probability up somewhat as well.”
In the short term, the note says that the 6-month likelihood is only 5%, but within a year it stands at 23%, in two years 48%, and in three years the “eye-popping” 76%.
To be honest, I believe that this assessment is far too optimistic, and it appears that researchers at Citigroup agree with me.  According to them, there is a 65 percent chance that the U.S. economy will plunge into recession by the end of next year.  Last week, Janet Yellen was asked about this during testimony before Congress
In testimony before Congress’ Joint Economic Committee, Yellen was asked by Rep. Pat Tiberi about a piece of research released by Citigroup’s rates strategy team Monday.
Specifically, Tiberi, an Ohio Republican, wanted to know what Yellen made of Citi’s conclusion that there is a 65 percent chance of a U.S. recession in 2016.
“The economists said that they would assign about a 65 percent likelihood of a recession in the United States in 2016. Now, 65 percent sounds high to me, but I’m not an economist and I’m not the Fed chair. But zero risk might be too low as well. So what would you assign a risk level of a recession next year?” Tiberi asked.
So how did Yellen respond?


Read More Here

Tuesday, December 1, 2015

Currently about 50 million Americans meet the USDA criteria for food insecurity. About 15 million of them are children.


(Brandon Warren / Flickr)

American Hunger-Related Healthcare Costs Exceeded $160 Billion in 2014, According to New Study

Food insecurity, especially for children, remains near record high despite the Great Recession’s official end.

BY Elizabeth Grossman
Currently about 50 million Americans meet the USDA criteria for food insecurity. About 15 million of them are children.

While the official end of the Great Recession is a full five years behind us, there are now nearly 12 million more Americans who lack enough resources to access adequate food than there were in 2007, a number that has only improved slightly since United States food insecurity peaked at over 21 percent in 2009. These statistics alone are disturbing. But as detailed in a new study released today as part of Bread for the World Institute’s 2016 Hunger Report, absence of food security in the U.S. carries enormous healthcare costs, more than $160 billion in 2014.

Using data from the U.S. Department of Agriculture (USDA), Census Bureau and research on food security published in peer-reviewed academic journals between 2005 and 2015, a team of researchers led by Boston University School of Medicine associate professor of pediatrics John Cook, estimated these health care costs by looking at the costs of treating diseases and health conditions associated with household food insecurity plus earnings lost when people took time off work because of these illnesses or to care for family members with illnesses related to food insecurity.

As Cook, who is also research scientist and principal investigator with Children’s Health Watch, explained to In These Times, lack of access to adequate food does not necessarily directly cause a particular illness but “plays a role in that disease occurring.” Years of research consistently shows food insecurity increases the risk for a range of health problems. These risks are particularly great for children but poor and inadequate nutrition also increases risk for adult health problems, including obesity and chronic diseases, among them diabetes, hypertension and cardiovascular disease. It also exacerbates illness duration and severity–in some cases simply because people lack money for medication–and therefore treatment costs.

Putting this in a broader economic context, Bread for the World Institute points out that the U.S. “spends more per capita on health care than any other high-income country but compares poorly with these others on key population health indicators such as life expectancy and child survival. This is due,” report authors, “in part to our tolerance as a nation, for higher levels of poverty and hunger.”

Currently about 50 million Americans meet the USDA criteria for food insecurity. About 15 million of them are children. In 2014, 19.2 percent of U.S. households with children were food 
insecure–about a third higher than households without. The Boston University research team found if the costs of special education for children whose learning abilities are adversely affected by food insecurity are factored in along with related education impacts for high-schoolers, the $160 billion rose by an additional  nearly $18 billion. This brings a total estimate of direct and indirect health care costs of U.S. food insecurity in 2014 to $178.93 billion.


Read More Here

Friday, October 9, 2015

102.6 million working age Americans without jobs right now. That is not an economic recovery – that is an economic depression .

...

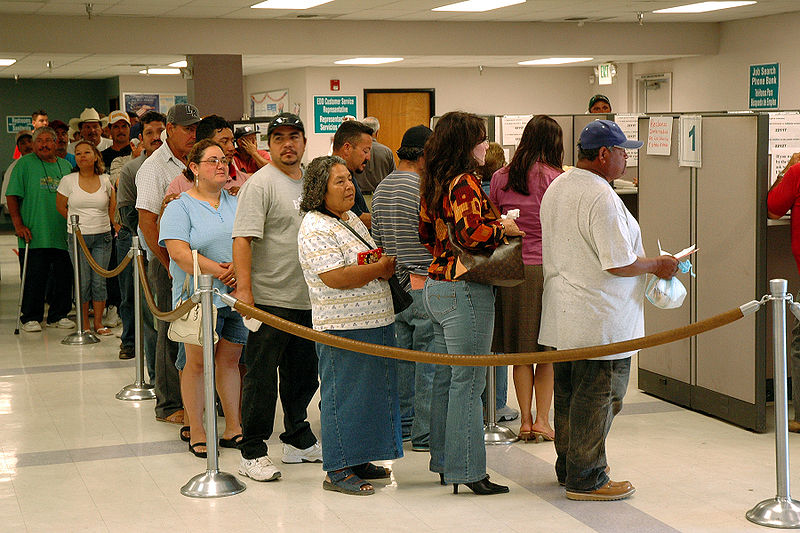
File:FEMA - 29783 - Workers unemployed by the freeze in California.jpgUnemployment Line  -  Wikipedia.org

The Economic Collapse

Right Now There Are 102.6 Million Working Age Americans That Do Not Have A Job

 
The federal government uses very carefully manipulated numbers to cover up the crushing economic depression that is going on in this nation.  For the month of September, the federal government told us that 142,000 jobs were added to the economy.  If that was actually true, that would barely be enough to keep up with population growth.  Sadly, the truth is that the real numbers were actually far worse than that.  The unadjusted numbers show that the U.S. economy actually lost 248,000 jobs in September and the government added more than a million Americans to the “not in the labor force” category.  When I first saw that number I truly believed that it was inaccurate.  But you can find the raw figures right here.  According to the Obama administration, there are currently 7.9 million Americans that are “officially unemployed” and another 94.7 million working age Americans that are “not in the labor force”.  That gives us a grand total of 102.6 million working age Americans that do not have a job right now.

That is not an economic recovery – that is an economic depression of an almost unbelievable magnitude.

This is something that my friend Mac Slavo pointed out the other day.  I encourage you to read his analysis right here.  If we measured unemployment the way that we did decades ago, we would all be talking about how similar Obama’s economy is to the Great Depression of the 1930s.
But instead we let the feds get away with feeding us this completely fraudulent “5.1 percent” unemployment number and most of us believe the mainstream media when they tell us that everything is just fine.


Read More Here

102.6 million working age Americans without jobs right now. That is not an economic recovery – that is an economic depression .

...
File:FEMA - 29783 - Workers unemployed by the freeze in California.jpgUnemployment Line  -  Wikipedia.org

The Economic Collapse

Right Now There Are 102.6 Million Working Age Americans That Do Not Have A Job

 
The federal government uses very carefully manipulated numbers to cover up the crushing economic depression that is going on in this nation.  For the month of September, the federal government told us that 142,000 jobs were added to the economy.  If that was actually true, that would barely be enough to keep up with population growth.  Sadly, the truth is that the real numbers were actually far worse than that.  The unadjusted numbers show that the U.S. economy actually lost 248,000 jobs in September and the government added more than a million Americans to the “not in the labor force” category.  When I first saw that number I truly believed that it was inaccurate.  But you can find the raw figures right here.  According to the Obama administration, there are currently 7.9 million Americans that are “officially unemployed” and another 94.7 million working age Americans that are “not in the labor force”.  That gives us a grand total of 102.6 million working age Americans that do not have a job right now.

That is not an economic recovery – that is an economic depression of an almost unbelievable magnitude.

This is something that my friend Mac Slavo pointed out the other day.  I encourage you to read his analysis right here.  If we measured unemployment the way that we did decades ago, we would all be talking about how similar Obama’s economy is to the Great Depression of the 1930s.
But instead we let the feds get away with feeding us this completely fraudulent “5.1 percent” unemployment number and most of us believe the mainstream media when they tell us that everything is just fine.


Read More Here

Friday, August 23, 2013

US Economic Policy: Keeping Wages Flat Since 1979


Pro-worker policies have been under attack for a generation, but the last decade has been simply devastating, says report

- Jon Queally, staff writer
In the United States of America the rich get richer, the poor stay poor, and the middle class—if they're lucky—just stay "flat".
(Credit: Kokouu/Getty Images) For the last tens years, according to a new report by the Economic Policy Institute, the failure of the economy to provide a living wage to a majority of its workers has created a decade of stagnation.
The central problem, say the report's authors Lawrence Mishel and Heidie Shierholz, is that "wage and benefit growth of the vast majority" of workers has remained steady—or even declined—amid rising costs of living while the "fruits of overall growth have accrued disproportionately to the richest households" in the country.
"The wage-setting mechanism has been broken for a generation," write Mishel and Shierholz, "but has particularly faltered in the last 10 years."
"Corporate profits, on the other hand, are at historic highs," they continue. "Income growth has been captured by those in the top 1 percent, driven by high profitability and by the tremendous wage growth among executives and in the finance sector."
The cause of this situation, according to the report, began just as Ronald Reagan was about to be ushered into power in 1979 and is "the result of intentional policy decisions—including globalization, deregulation, weaker unions, and lower labor standards such as a weaker minimum wage—that have undercut job quality for low- and middle-wage workers. These policies have all been portrayed to the public as giving American consumers goods and services at lower prices," but their real impact has been to cut earning power and upward mobility while making widely shared prosperity an impossibility.
To reverse this trend, the EPI analysis calls for two key policy initiatives. First, a commitment to severely curb unemployment by promoting a new surge in public investment, including a restoration of public services cut during the recent years of recession. And secondly, a national increase in wages across all sectors and the restoration of strong labor protections, including collective bargaining protections for union workers and an increase in the national minimum wage as key components of that effort.
This paper’s other key findings include:
  • According to every major data source, the vast majority of U.S. workers—including white-collar and blue-collar workers and those with and without a college degree—have endured more than a decade of wage stagnation. Wage growth has significantly underperformed productivity growth regardless of occupation, gender, race/ethnicity, or education level.
  • During the Great Recession and its aftermath (i.e., between 2007 and 2012), wages fell for the entire bottom 70 percent of the wage distribution, despite productivity growth of 7.7 percent.
  • Weak wage growth predates the Great Recession. Between 2000 and 2007, the median worker saw wage growth of just 2.6 percent, despite productivity growth of 16.0 percent, while the 20th percentile worker saw wage growth of just 1.0 percent and the 80th percentile worker saw wage growth of just 4.6 percent.
  • The weak wage growth over 2000–2007, combined with the wage losses for most workers from 2007 to 2012, mean that between 2000 and 2012, wages were flat or declined for the entire bottom 60 percent of the wage distribution (despite productivity growing by nearly 25 percent over this period).
  • Wage growth in the very early part of the 2000–2012 period, between 2000 and 2002, was still being bolstered by momentum from the strong wage growth of the late 1990s. Between 2002 and 2012, wages were stagnant or declined for the entire bottom 70 percent of the wage distribution. In other words, the vast majority of wage earners have already experienced a lost decade, one where real wages were either flat or in decline.
  • This lost decade for wages comes on the heels of decades of inadequate wage growth. For virtually the entire period since 1979 (with the one exception being the strong wage growth of the late 1990s), wage growth for most workers has been weak. The median worker saw an increase of just 5.0 percent between 1979 and 2012, despite productivity growth of 74.5 percent—while the 20th percentile worker saw wage erosion of 0.4 percent and the 80th percentile worker saw wage growth of just 17.5 percent.
___________________________________
Enhanced by Zemanta